VIX: Wall Street's 30-Day S&P 500 Fear Forecast
Uncover the truth about the CBOE Market Volatility Index (VIX). It doesn't measure today's fear, but predicts S&P 500 moves 30 days ahead.
The VIX: Wall Street’s Fear Forecast
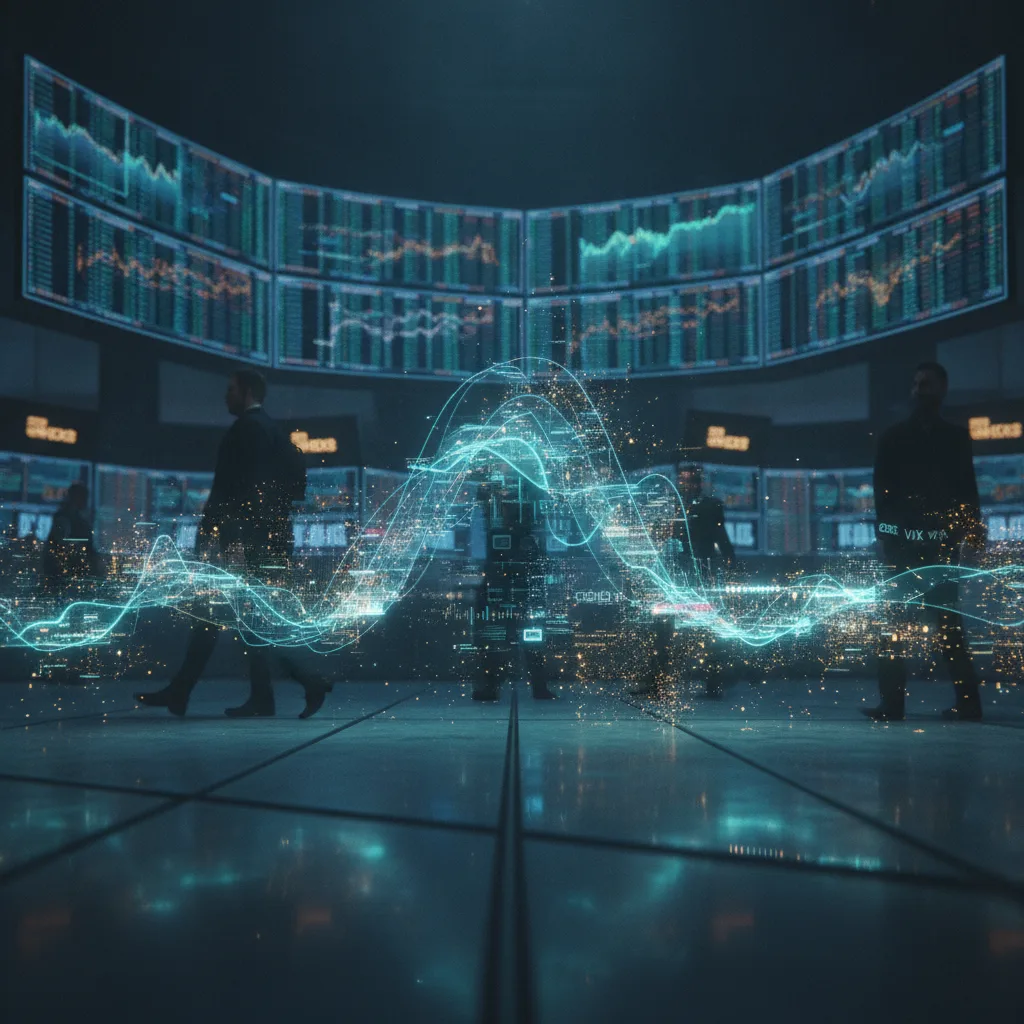
Wall Street has a sort of crystal ball. It’s called the VIX. Most people misunderstand it. They think the VIX measures today’s market fear. It doesn’t. The CBOE Market Volatility Index (VIX) actually predicts how much the S&P 500 stock index will move. It looks 30 days ahead. Think of it as a market weather report. It tells you if investors expect calm or stormy days. A high VIX means traders see big price swings coming. This makes it a key tool for understanding investor mood and market trouble.
How Wall Street forecasts volatility
The CBOE launched its first VIX in 1993. It measured expected volatility using options on the S&P 100 stock index. This early VIX set a standard for market uncertainty.
In 2003, the Chicago Board Options Exchange (CBOE) updated the VIX. The new method uses options on the much broader S&P 500 (SPX) index. This change made the VIX better show how U.S. large-cap stocks felt, according to the CBOE’s official white paper.
The VIX specifically measures implied volatility for many S&P 500 index options. What is implied volatility? It’s the market’s guess about future price swings. We get it from the prices of options contracts themselves. Options are financial tools. They give you the right to buy or sell an asset at a set price by a certain date. You don’t have to use that right.
The calculation focuses on out-of-the-money options. These options would not make money if used right away. Traders buy and sell them to bet on, or protect against, big price moves. Their prices show what everyone expects for the S&P 500’s future movement. The VIX formula then combines these prices. It produces a single, yearly percentage value.
A history of market unease
On September 15, 2008, Lehman Brothers filed for bankruptcy. This marked a low point in the financial crisis. The VIX surged dramatically in the following weeks. It reached an all-time closing high of 80.86 on November 20, 2008, Bloomberg data shows. This spike showed extreme uncertainty and fear across global markets.
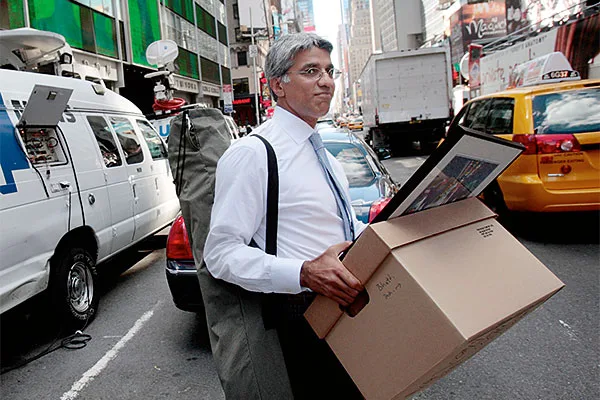
The iconic scene of Lehman Brothers employees leaving their New York City headquarters with boxes on September 15, 2008, captured the profound market fear and uncertainty that led the VIX to surge to an all-time high of 80.86. (Source: ft.com)
More recently, the COVID-19 pandemic caused another historic VIX surge. On March 16, 2020, lockdowns spread and economic activity stopped. The VIX closed at 82.69. This beat the 2008 peak. It signaled record expected market trouble, according to data from the Federal Reserve Bank of St. Louis. High VIX readings usually come with sharp stock market drops.
When the economy grows and interest rates are low, the VIX often stays low. For example, through much of 2017, the VIX stayed below 15. It often dipped below 10. This showed investors felt comfortable and saw little risk in the market. A low VIX suggests investors expect calm, steady market conditions.
The VIX usually moves opposite to the stock market. When the S&P 500 falls, the VIX typically rises. This confirms its role as a “fear gauge.” Traders often see fast VIX increases as a sign to lower their risk.
Why the VIX matters to investors and the economy
A high VIX reading often signals market drops or big uncertainty. This makes it an important measure of overall market mood. Investors watch the VIX closely for clues about where the market might go.
Portfolio managers use VIX futures and options to protect against losses. This is called hedging. For example, a fund manager with many stocks might buy VIX futures contracts. If the market drops, their stocks lose value. But the VIX futures gain value, which offsets some losses. BlackRock, a giant asset manager, often talks about how volatility products help manage risk in its investment outlooks.
The VIX also works as a trading tool. You cannot directly buy or sell the VIX index. But you can trade VIX futures contracts or exchange-traded products (ETPs) linked to VIX futures. These ETPs, like ETFs and ETNs, let people bet on future market volatility. This creates a market for volatility itself. Traders can bet on whether the “fear gauge” will rise or fall.
Understanding the VIX futures curve is also important. This curve shows VIX futures prices for different months. Usually, the VIX futures curve is in contango. This means later-dated contracts cost more than near-term ones. It shows that expected volatility naturally grows over longer periods. When the curve shifts to backwardation, near-term contracts become more expensive. This often signals immediate market stress and fear. JPMorgan Chase analysts often point out shifts in the VIX futures curve as market signals in their research reports.

In March 2020, as COVID-19 lockdowns spread globally, economic activity halted, leading to a historic surge in the VIX, which closed at 82.69, signaling record expected market trouble. (Source: globalnews.ca)
Beyond direct trading, the VIX can also show things about the economy. VIX spikes often match rising global tensions, uncertain economic policies, or health crises. It is not a direct economic measure. However, it shows how these factors affect market confidence. A high VIX for a long time can signal deep investor worries about the economy’s future.
Frequently asked questions
What does a “normal” VIX reading look like? A VIX reading between 10 and 20 is normal. This means a calm market where investors expect average price swings. Readings below 10 can show complacency. Those above 20 often signal growing uncertainty.
Can I directly invest in the VIX? No, you cannot directly invest in the VIX index itself. The VIX is a calculated number, not a tradable asset. But you can invest in financial products that track VIX movements. These include VIX futures contracts, or VIX-linked ETFs and ETNs.
Does a high VIX always mean the market will crash? Not always. A high VIX means the market expects higher volatility. This often comes with market downturns. But it does not guarantee a crash. Sometimes, a high VIX can signal a bottom. Extreme fear often comes before a market rebound.
Is the VIX only for professional traders? Professional traders use the VIX a lot for hedging and betting. But individual investors can also benefit from understanding it. Watching the VIX gives you a feel for overall market mood. It helps you make choices about risk in your personal portfolio.
Beyond the numbers: the future of volatility
The VIX is still a key to understanding market mood. However, the financial world always changes. New volatility indexes are appearing. They focus on different asset classes or market parts. For example, the CBOE Nasdaq 100 Volatility Index (VXN) tracks expected tech stock volatility. It gives a more detailed look.
Automated trading and high-frequency trading have changed market volatility. These technologies can make prices swing widely in milliseconds. Future volatility measures might need to directly track these fast, machine-driven moves. Researchers at places like the National Bureau of Economic Research keep studying how these factors affect market stability.
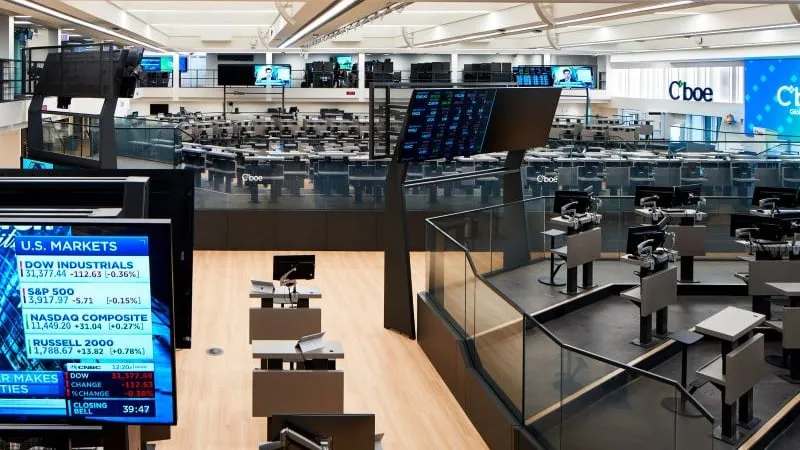
The Chicago Board Options Exchange (CBOE) is the birthplace of the VIX, or 'fear index,' and remains the world's largest options exchange, a pivotal hub for financial derivatives trading. (Source: chicagobusiness.com)
Even with new tools and complexities, the VIX will likely keep its main job as a forward-looking “fear gauge.” It is a simple, strong measure that comes from complex market workings. Global markets link up more. So watching expected volatility will stay important for investors, policymakers, and anyone trying to understand finance.
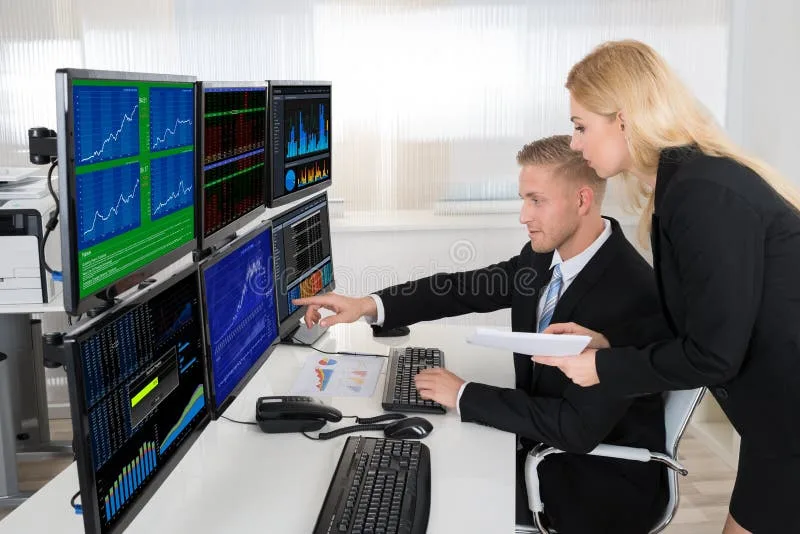
A modern financial trading desk, often featuring multiple screens displaying real-time data and complex charts, represents the 'new tools and complexities' and 'complex market workings' that underpin indices like the VIX, helping investors and policymakers monitor global market volatility. (Source: dreamstime.com)
You might also like:
👉 Predicting Stock Market Trends: ML & Sentiment Analysis Guide